Section 4.1
Definition 13
A periodic function is a function \(f\) such that
for every real number \(x\) in the domain of \(f\), every integer \(n\), and some positive real number \(p\). The least possible positive value of \(p\) is the period of the function.
The sine and cosine function are periodic functions with period \(2\pi\). That is,
for any integer \(n\).
Graph of the Sine Function
The domain of the sine function is the set of all real numbers.
The range of the sine function is the interval \([-1,1]\). This means for all real number \(x\), we have, \(-1\le \sin(x)\le 1\).
Some key values when plotting the sine function:
\(x\) |
\(\sin(x)\) |
|---|---|
\(0\) |
\(0\) |
\(\frac{\pi}{2}\) |
\(1\) |
\(\pi\) |
\(0\) |
\(\frac{3\pi}{2}\) |
\(-1\) |
\(2\pi\) |
\(0\) |
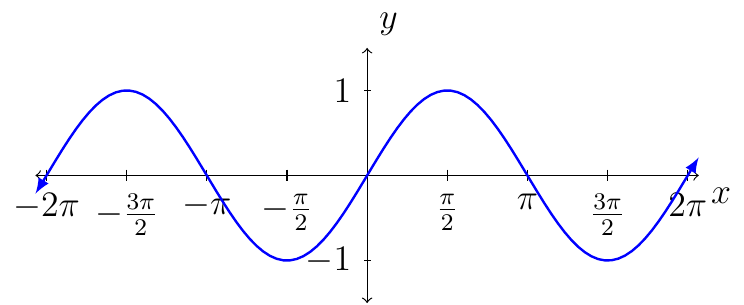
The sine function is continuous everywhere.
The length of one period for the sine function is \(2\pi\).
The graph of the sine function is symmetric about the origin.
This mean the sine function is odd.
That is, \(\sin(-x)=-\sin(x)\).
Grpah of the Cosine Function
The domain of the cosine function is the set of real numbers.
The range of the cosine function is the interval \([-1,1]\). That is, for all \(x\) in the real numbers, we have, \(-1\le \cos(x)\le 1\).
Some key values when plotting the cosine function:
\(x\) |
\(\cos(x)\) |
|---|---|
\(0\) |
\(1\) |
\(\frac{\pi}{2}\) |
\(0\) |
\(\pi\) |
\(-1\) |
\(\frac{3\pi}{2}\) |
\(0\) |
\(2\pi\) |
\(1\) |
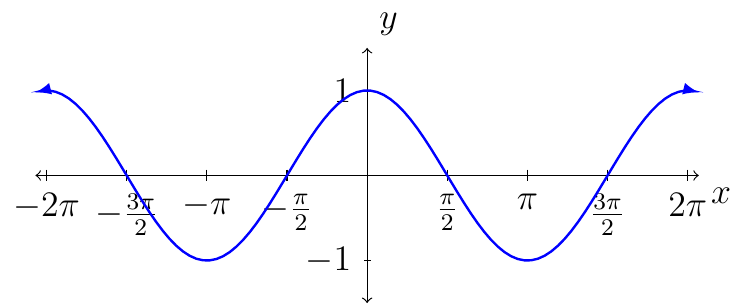
The cosine function is continuous everywhere.
The length of one period for the cosine function is \(2\pi\).
The graph of the cosine function is symmetric about the \(y\)-axis.
This mean the sine function is even.
That is, \(\cos(-x)=\cos(x)\).
Graph of \(y=A\cos(x)\) and \(y=A\sin(x)\)
Definition 14 (Amplitude)
The graph of \(y=A\sin(x)\) or \(y=A\cos(x)\), with \(a\ne0\), will have the same shape as the graph of \(y=\sin(x)\) or \(y=\cos(x),\)respectively, except with the range of \(-|A|\le y\le|A|\).
The amplitude is \(|A|\).
Example 24
Plot the graph of \(y=2\cos(x)\).
Solution:
The amplitude of the graph is \(|2|=2\).
Let \(x=\{0,\frac{\pi}{2},\pi,\frac{3\pi}{2},2\pi \}\). Then consider the following table of values:
x |
\(y=\cos(x)\) |
\(y=2\cos(x)\) |
|---|---|---|
\(0\) |
\(1\) |
\(2\) |
\(\frac{\pi}{2}\) |
\(0\) |
\(0\) |
\(\pi\) |
\(-1\) |
\(-2\) |
\(\frac{3\pi}{2}\) |
\(0\) |
\(0\) |
\(2\pi\) |
\(1\) |
\(2\) |
From the table we see that we want to plot the following points:
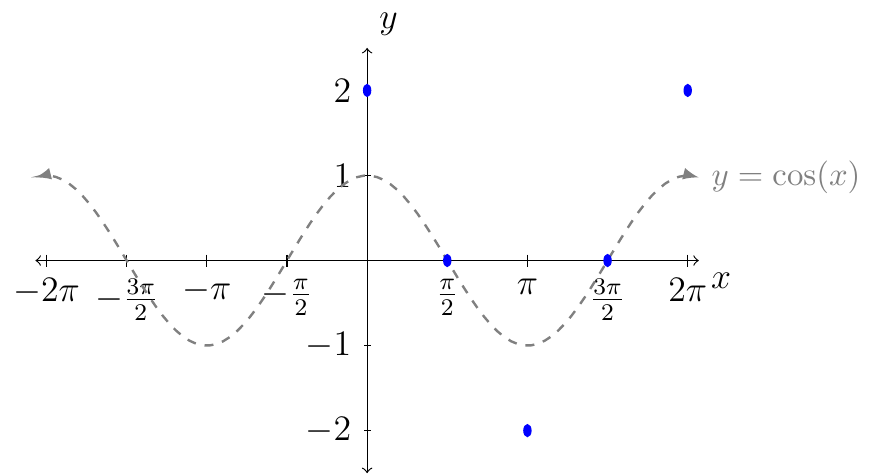
Next, we connect the dots following the behavior of the curves from the graph of \(y=\cos(x)\) (as shown in gray).
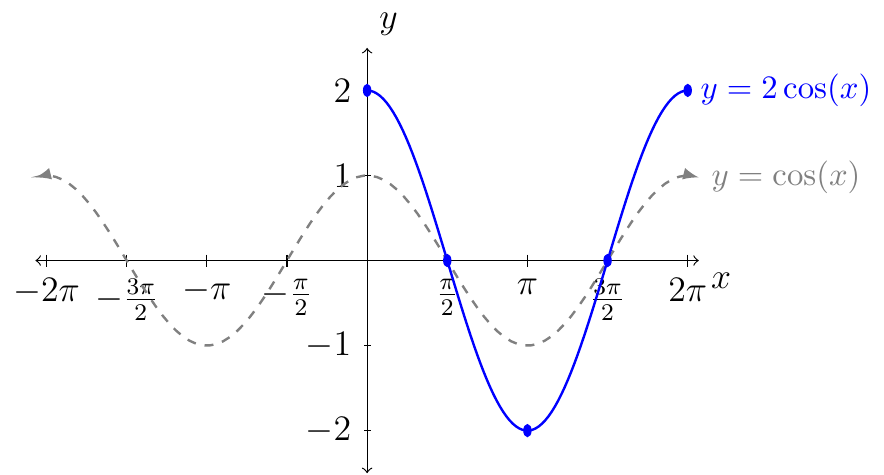
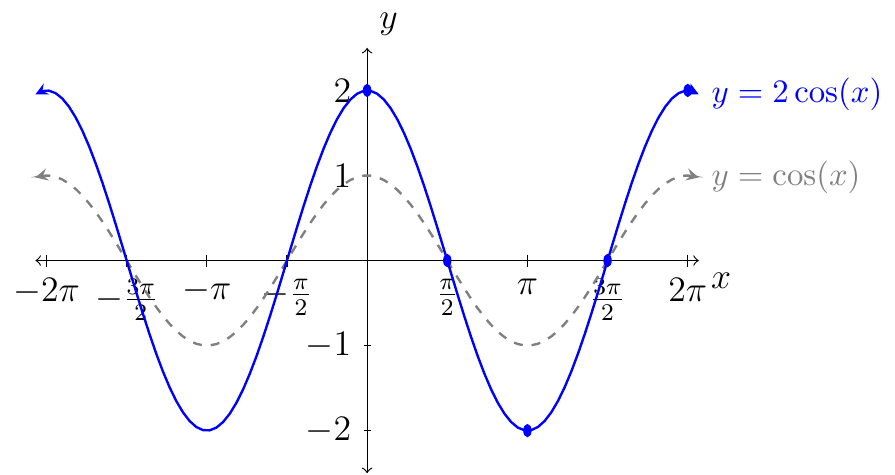
Above is the graph of \(y=2\cos(x)\) over one period. To represent the graph of \(y=2\cos(x)\) over its domain we have.
Example 25
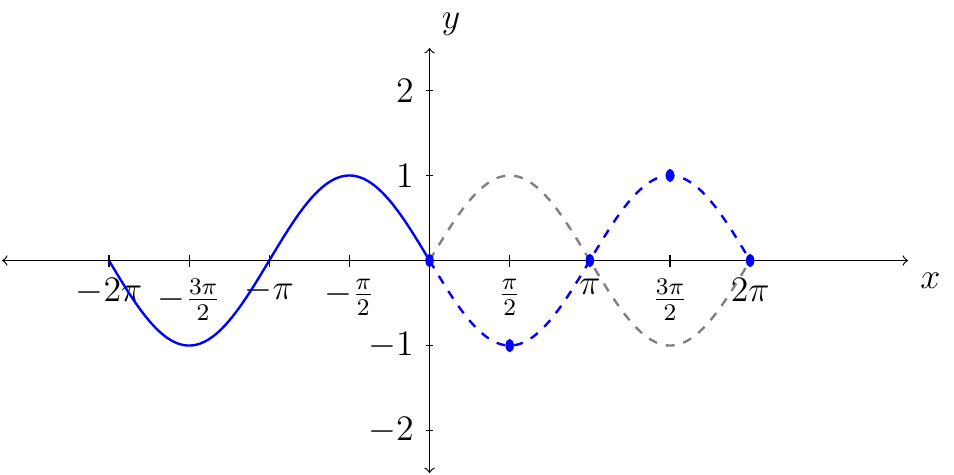
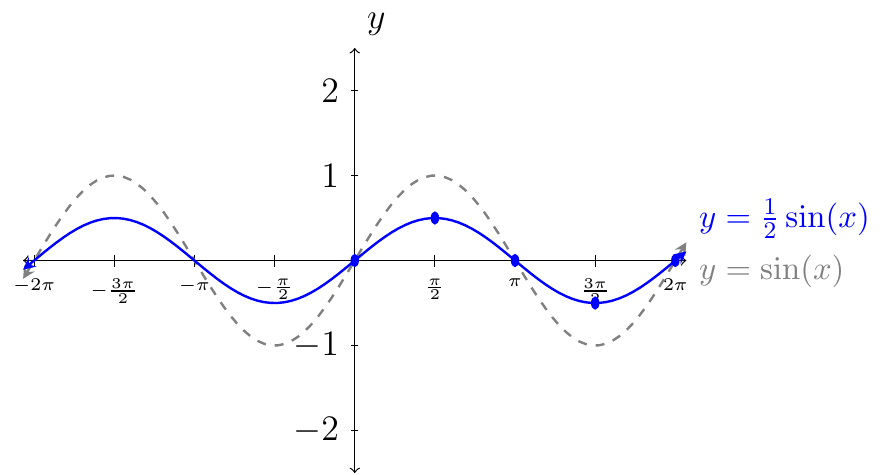
Plot \(y=\frac{1}{2}\sin(x)\).
Solution:
The amplitude of the graph is \(|\frac12|=\frac12\).
Let \(x=\{0,\frac{\pi}{2},\pi,\frac{3\pi}{2},2\pi \}\). Then consider the following table of values:
\(x\) |
\(\sin(x)\) |
\(\frac12 \sin(x)\) |
|---|---|---|
\(0\) |
\(0\) |
\(0\) |
\(\frac{\pi}{2}\) |
\(1\) |
\(\frac12\) |
\(\pi\) |
\(0\) |
\(0\) |
\(\frac{3\pi}{2}\) |
\(-1\) |
\(-\frac12\) |
\(2\pi\) |
\(0\) |
\(0\) |
From the table we see that we want to plot the following points:
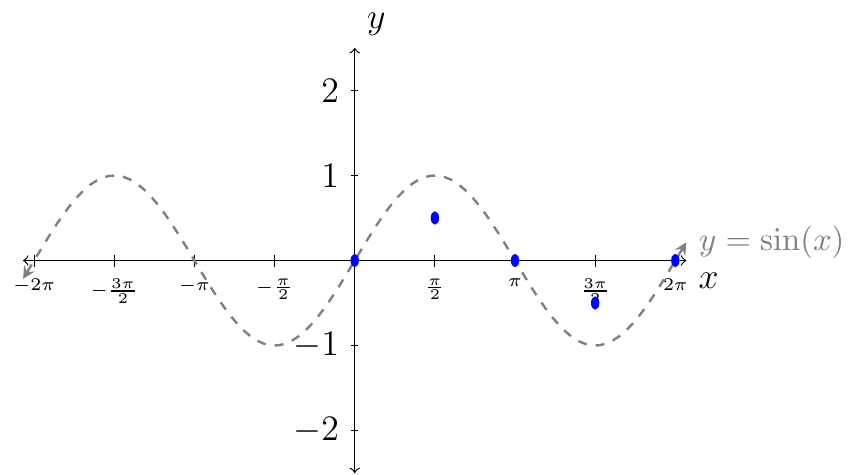
Next, we connect the dots following the behavior of the curves from the graph of \(y=\sin(x)\) (as shown in gray).
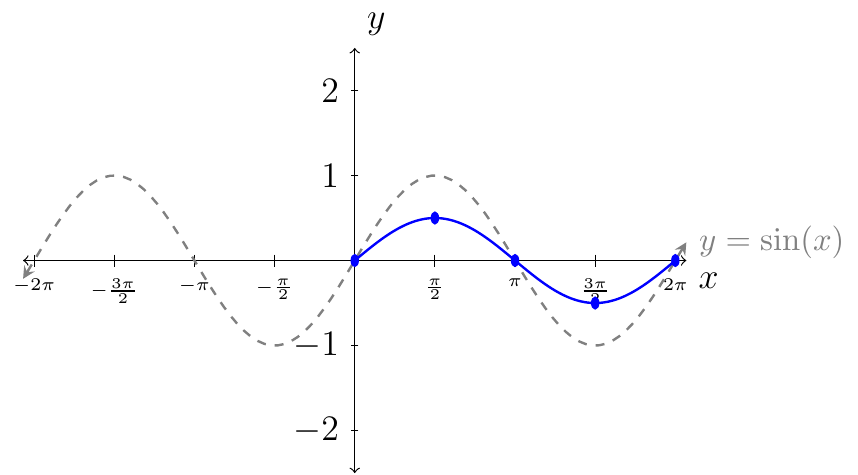
Above is the graph of \(y=\frac12 \sin(x)\) over one period. To represent the graph of \(y=\frac12 \sin(x)\) over its domain we have.
Graph of \(y=\cos(Bx)\) and \(y=\sin(Bx)\)
For \(b>0\), the graph of \(y=\sin(Bx)\) will resemble that of \(y=\sin(x)\), but with period \(\frac{2\pi}{b}\). Also, the graph of \(y=\cos(Bx)\) will resemble that of \(y=\cos(x)\), but with period \(\frac{2\pi}{B}\).
Example 27
Plot \(y=\sin(\frac34 x)\).
Solution:
First, we see that the amplitude is \(1\).
Second, we want to compute the new period. In this case \(B=\frac34\). Using \(\frac{2\pi}{B}\) the new period is:
This means the graph of \(y=\sin(\frac34 x)\) over one period will be over the interval \([0,\frac{8\pi}{3}]\). Next, we want to split the period interval into four equal length subintervals. To do this we first find
Since we are starting at \(x_0=0\), we know that \(x_1=x_0+1\Delta x\). Then we will do this up to \(x_4\). That is,
Next, evaluate \(y=\sin(\frac34 x)\) at \(x_0\), \(x_1\), \(x_2\), \(x_3\), and \(x_4\).
\(x_i\) |
\(\frac34 x_i\) |
\(y=\sin(\frac34 x_i)\) |
|
|---|---|---|---|
\(x_0\) |
\(0\) |
\(0\) |
\(0\) |
\(x_1\) |
\(\frac{2\pi}{3}\) |
\(\frac{\pi}{2}\) |
\(1\) |
\(x_2\) |
\(\frac{4\pi}{3}\) |
\(\pi\) |
\(0\) |
\(x_3\) |
\(2\pi\) |
\(\frac{3\pi}{2}\) |
\(-1\) |
\(x_4\) |
\(\frac{8\pi}{3}\) |
\(2\pi\) |
\(0\) |
From the table we then plot the following points:
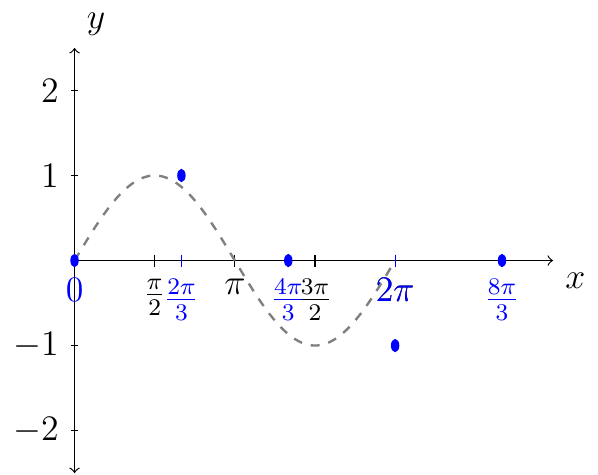
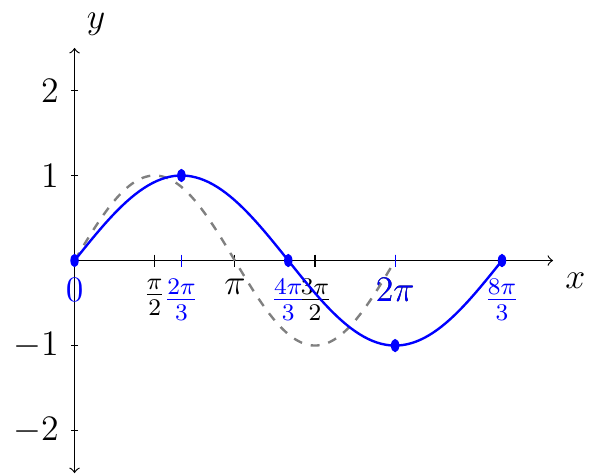
Next, complete the curve through the points for a plot of one period for the graph of \(y=\sin(\frac34 x)\).
Example 27
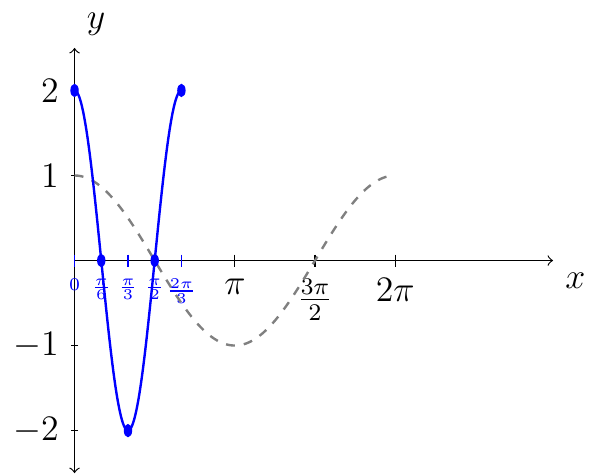
Plot \(y=2\cos(3 x)\).
Solution:
First, we see that the amplitude is \(2\).
Second, we want to compute the new period. In this case \(B=3\). Using \(\frac{2\pi}{B}\) the new period is:
This means the graph of \(y=2\cos(3 x)\) over one period will be over the interval \([0,\frac{2\pi}{3}]\). Next, we want to split the period interval into four equal length subintervals. To do this we first find
Since we are starting at \(x_0=0\), we now that \(x_1=x_0+1\Delta x\). Then we will do this up to \(x_4\). That is,
Next, evaluate \(y=2\cos(3 x)\) at \(x_0\), \(x_1\), \(x_2\), \(x_3\), and \(x_4\).
\(x_i\) |
\(3 x_i\) |
\(y=2\cos(3 x_i)\) |
|
|---|---|---|---|
\(x_0\) |
\(0\) |
\(0\) |
\(2\) |
\(x_1\) |
\(\frac{\pi}{6}\) |
\(\frac{\pi}{2}\) |
\(0\) |
\(x_2\) |
\(\frac{\pi}{3}\) |
\(\pi\) |
\(-2\) |
\(x_3\) |
\(\frac{\pi}{2}\) |
\(\frac{3\pi}{2}\) |
\(0\) |
\(x_4\) |
\(\frac{2\pi}{3}\) |
\(2\pi\) |
\(2\) |
From the table we then plot the following points:
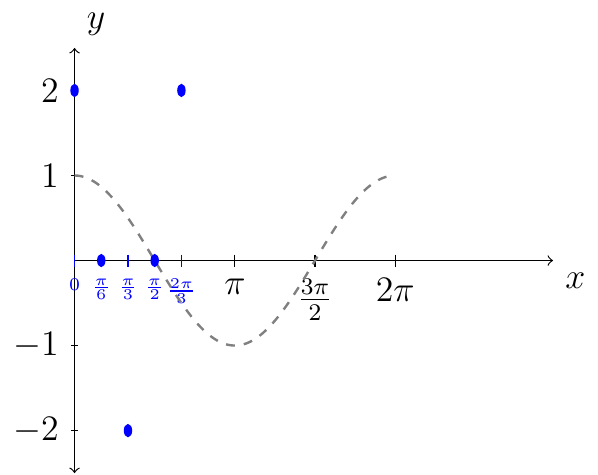
Next, complete the curve through the points for a plot of one period for the graph of \(y=2\cos(3 x)\).
Graph of \(y=\cos(x)\) and \(y=\sin(x)\) with Reflections
Given the graph of \(y=f(x)\). We know the graph of \(y=-f(x)\) is the graph of \(y=f(x)\) but reflected about the \(x\)-axis.
Given the graph of \(y=g(x)\). We know the graph of \(y=g(-x)\) is the graph of \(y=g(x)\) but reflected about the \(y\)-axis.
For example: \(y=-\cos(x)\) where \(x\in[0,2\pi]\).
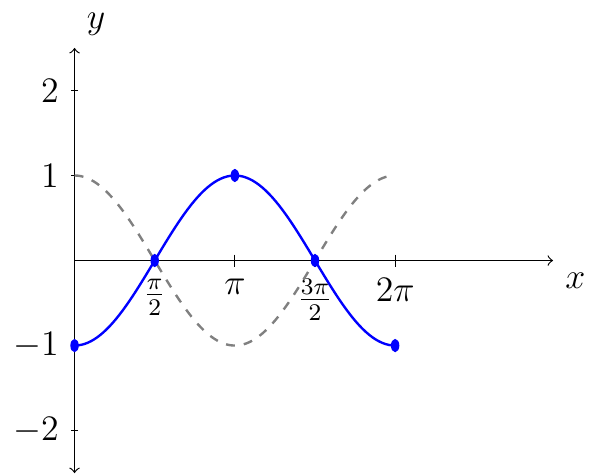
Another example: \(y=\sin(-x)\) where \(x\in[-2\pi,2\pi]\). The solid blue line shows the reflection with respect to the gray dashed line.